
Finding a therapist in America isn’t the same experience everywhere. Where you live shapes how quickly you can get an appointment, whether any nearby providers take your insurance, and whether the cost fits your budget.
To understand where access is strongest and where multiple barriers tend to stack, Grow Therapy ranked the 50 largest U.S. cities using eight factors:
- Provider availability
- Federal mental health provider shortage scores
- Uninsured rates
- Housing costs relative to income
- Income inequality
- Broadband access
- Violent crime rates
- Access to parks and green space.
Each factor is included for a reason. Provider availability and federal shortage scores measure whether there are enough clinicians to meet demand. Uninsured rates and rent burden reflect whether people can realistically afford care. Broadband access matters because telehealth has become a primary way people see therapists — limited connectivity limits who can actually use it.
The last two factors are about the environment itself. Research consistently suggests that even 20-30 minutes in a natural setting can reduce stress hormones and improve mood. Higher crime, meanwhile, has been linked to elevated stress and worse mental health outcomes over time, according to federal health data.
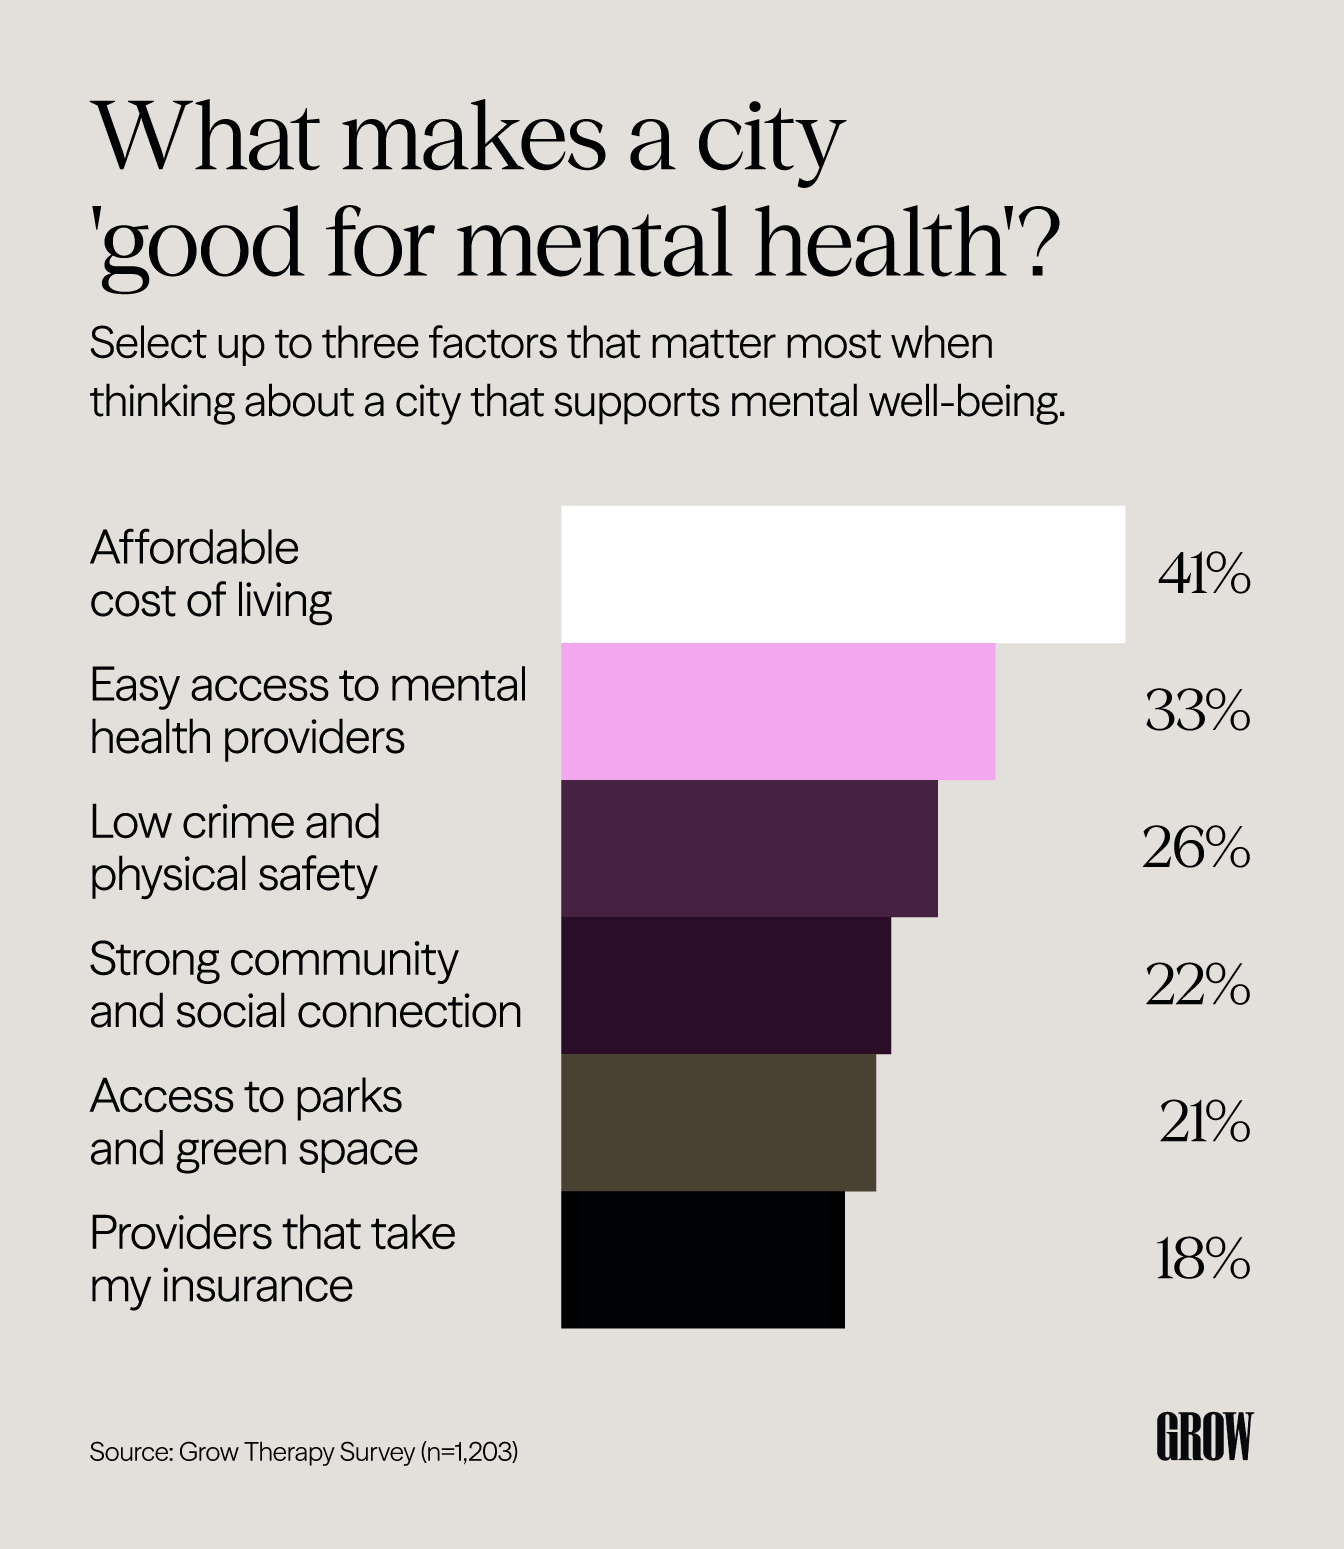
Grow Therapy’s survey of over 1,200 adults found that the three factors most commonly cited by Americans as important for a mentally healthy city are affordable cost of living (41%), easy access to providers (33%), and low crime (26%). These priorities shaped which variables were weighted most heavily, and which cities rose to the top.
Did you know?
The national average wait time for behavioral health services is 48 days — nearly seven weeks.
Key takeaways
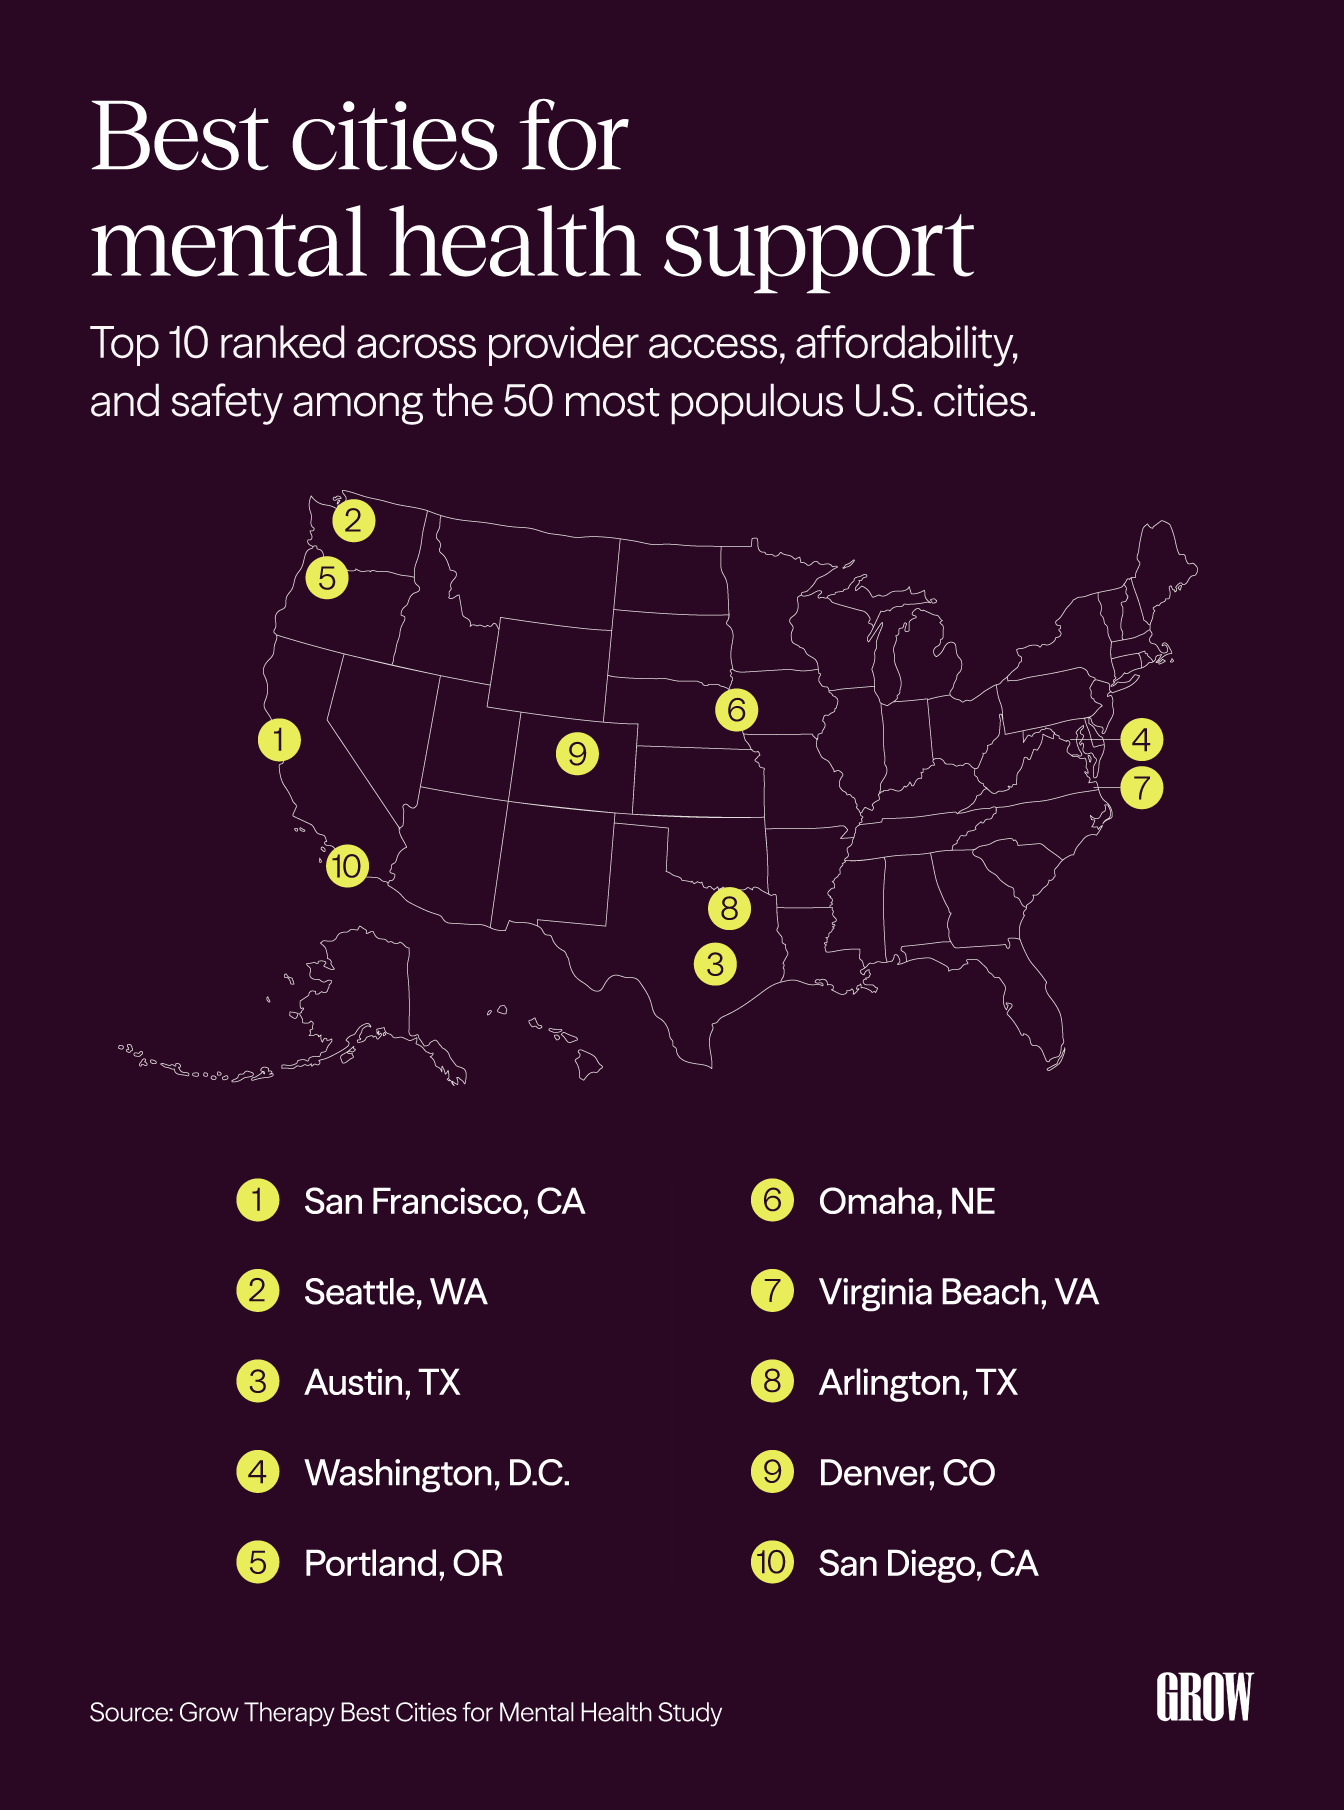
- San Francisco, Seattle, and Austin, TX, top the list of the best U.S. cities for mental health support.
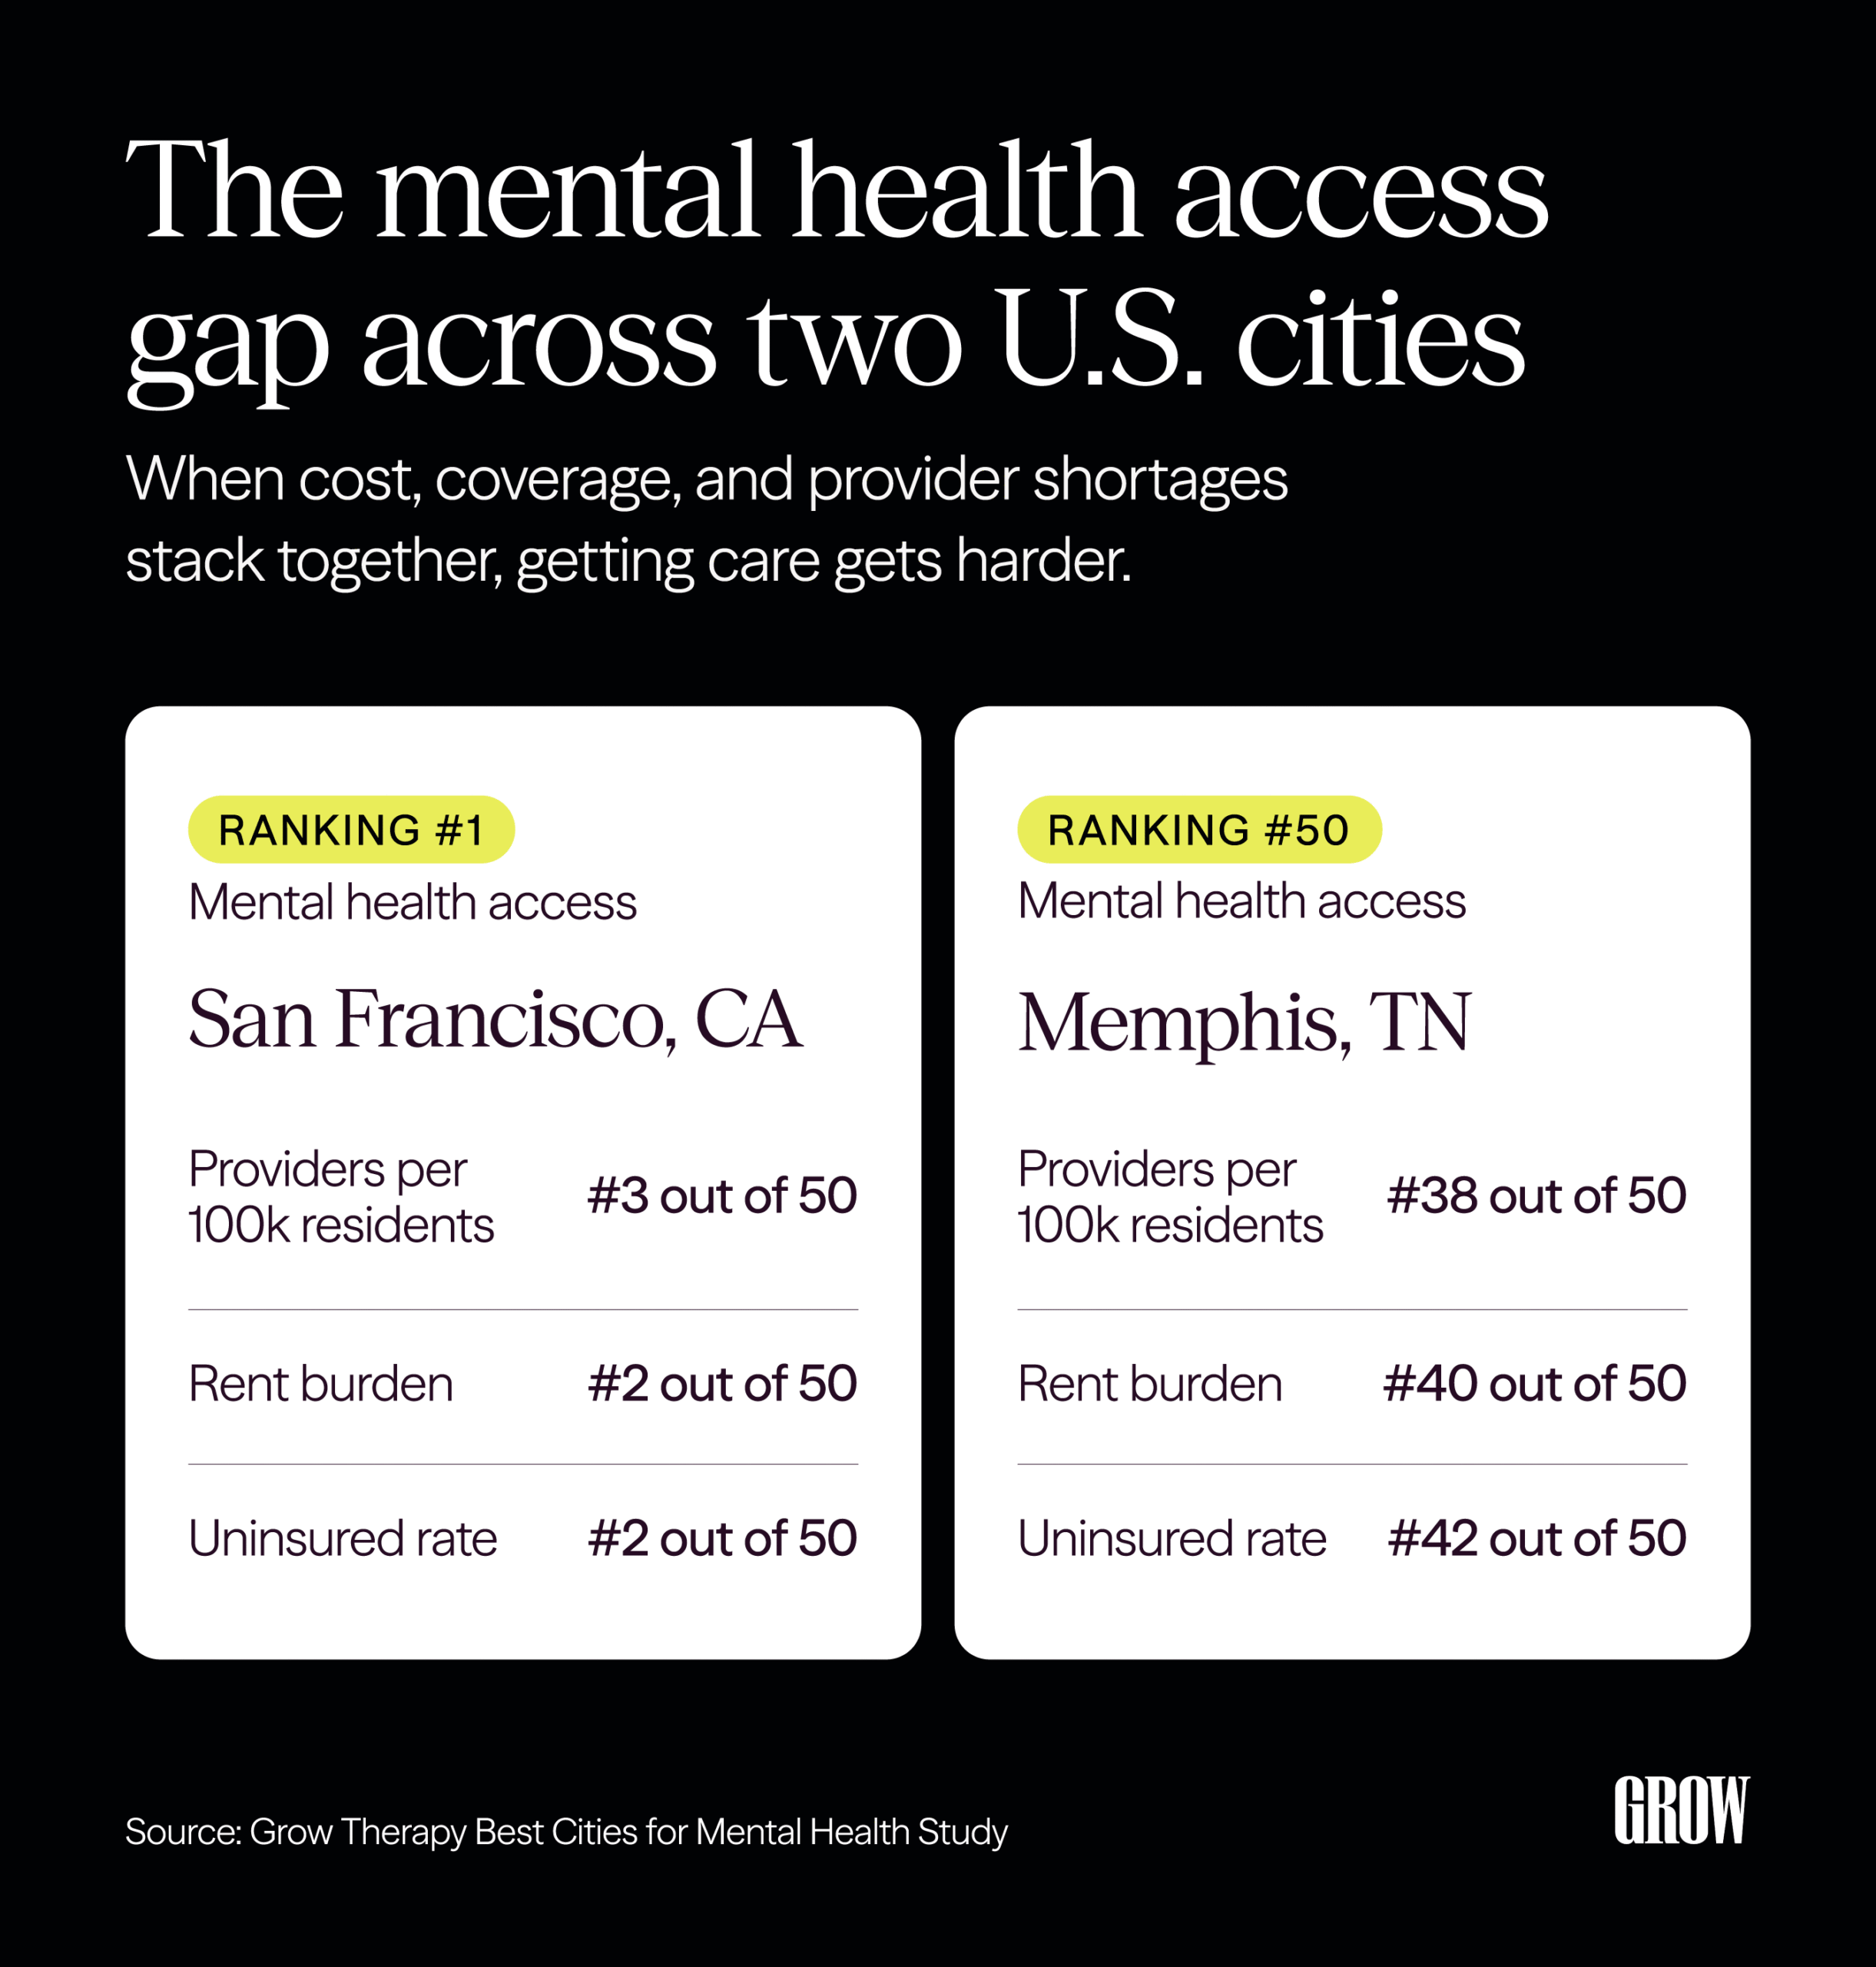
- Memphis (#50) shows what stacked barriers look like in the data: the highest violent crime rates, the lowest broadband access, high rent burdens, and some of the worst income inequality in the dataset all piling up in the same city.
- Cost of living (41%), provider access (33%), and safety (26%) were the most commonly cited factors when Americans were asked what makes a city good for mental health.
- One in five (21%) Americans has skipped mental health care because they couldn’t afford the out-of-pocket cost. Another 11% weren’t sure what their insurance would cover, and 9% found it didn’t cover mental health care at all.
The best U.S. cities for mental health support
The cities that ranked highest didn’t get there by dominating a single variable. They balanced access, affordability, and safety. The tables below highlight which factors drove each city’s ranking the most.
| Ranking | City |
|---|---|
| 1 | San Francisco, California |
| 2 | Seattle, Washington |
| 3 | Austin, Texas |
| 4 | Washington D.C. |
| 5 | Portland, Oregon |
| 6 | Omaha, Nebraska |
| 7 | Virginia Beach, Virginia |
| 8 | Arlington, Texas |
| 9 | Denver, Colorado |
| 10 | San Diego, California |
1. San Francisco, CA — where provider access and housing affordability converge
San Francisco’s top ranking defies the assumption that expensive cities are bad for mental health. It earns the top spot by combining the highest provider availability of any major California city with the second-lowest rent burden in the dataset. That last point surprises most people. San Francisco’s notoriously high rents are offset by equally high median incomes, which means the share of income renters spend on housing actually falls close to the national average, according to Realtor.com.
| Provider density | #3 — third-highest mental health providers per 100k residents |
| Rent burden | #2 — second-lowest percentage of cost-burdened renters in the dataset, behind only Arlington, TX |
| Broadband | Ranked #8 for household broadband access, supporting telehealth availability alongside a strong in-person supply |
| Park access | Almost all residents live within a 10-minute walk of a park — the highest in the dataset |
2. Seattle, WA — the telehealth-ready city
Seattle ranks second overall by combining solid provider supply with the highest broadband access in the entire dataset, making it well-positioned for both in-person and virtual care. It’s the closest thing to a telehealth-friendly city in the study. Consistent performance across all metrics drives its #2 finish, including a rent burden ranking lower than its coastal-city reputation might suggest.
One-third of Americans say easy access to providers is one of their top factors for a city that supports their mental health. Seattle’s combination of physical and digital access addresses both.
| Broadband access | #1 in the dataset — highest household broadband access of any city studied, making virtual care an easier option for nearly all residents |
| Rent burden | #4 — lower than Seattle’s coastal-city reputation might suggest |
| Provider density | #12 — solid mid-upper range; Seattle’s #2 finish overall reflects consistency across pillars, not dominance in one |
| HPSA (Health Professional Shortage Area) score | #6 — lower scores indicate a less severe federal designation of provider shortage |
3. Austin, TX — strong provider access, low crime, and competitive affordability
Austin earns the #3 spot by combining one of the lowest federal mental health provider shortage scores in the study with a below-average violent crime rate for a metro of its size. It’s the highest-ranking Texas city in the study and one of the few Sun Belt metros that score well on both access and safety. Austin’s HPSA score suggests that supply is positioned to meet demand more effectively than most cities its size.
The one caveat: a 34th-ranked uninsured rate means that for residents without coverage, Austin’s provider supply is meaningfully harder to reach.
| HPSA (Health Professional Shortage Area) score | #2 — provider supply is better aligned with population need than in most cities of its size |
| Violent crime rate | #10 — well below average for a metro of its size; physical safety is the third-most-cited factor Americans name for a city that supports mental well-being |
| Provider density | #17 — middle of the pack, but supported by the low shortage score, which suggests supply is reasonably aligned with need |
| Rent burden | #9 — competitive for a fast-growing metro, though renters face a higher burden than in Seattle or San Francisco |
| Uninsured rate | #34 — a real constraint; for residents without coverage, access to Austin’s provider supply is meaningfully limited |
4. Washington, DC — the coverage advantage
Washington, DC (#4) is the clearest example on the list of what near-universal coverage looks like in practice. Its lowest uninsured rate reflects a government-worker-heavy population with strong employer coverage. It pairs that with the fifth-highest provider density and one of the more evenly distributed income profiles in the dataset (#4 for income equality).
A 37th-ranked violent crime rate keeps DC out of the top three, a reminder that strong coverage and provider access don’t offset every structural challenge.
| Uninsured rate | #1 — the lowest of any city studied; a reflection of DC’s government-worker-heavy population and strong employer coverage |
| Provider density | #5 — fifth-highest mental health providers per 100k residents |
| Income equality | #4 — strong income distribution relative to other major metros |
| Violent crime rate | #37 — keeps DC out of the top three despite its coverage and provider access strengths |
#5. Portland, OR — consistent across every pillar
Portland earns #5 on the strength of a top-10 provider density, one of the lowest uninsured rates in the study, and strong broadband coverage. What keeps it out of the top three is a mid-range violent crime rate and the widest income inequality gap on this list of top ten cities. That combination limits who actually benefits from Portland’s access strengths.
A city where income is unevenly distributed can still leave a significant share of residents on the wrong side of that access, which is why income equality is weighted alongside provider counts and coverage rates.
| Provider density | #6 — sixth-highest mental health providers per 100k residents in the dataset |
| Uninsured rate | #6 — one of the lowest uninsured rates in the study, meaning more residents have coverage to use |
| Broadband access | #8 — strong digital infrastructure supporting telehealth alongside in-person care |
| Rent burden | #10 — housing costs are manageable relative to income, though not at the top of the study |
| Violent crime rate | #27 — a mid-range ranking that pulls the overall score down from where provider access alone might place it |
| Income equality | #28 — the widest income gap in this top-five grouping; inequality shapes who can realistically afford care even when providers are available |
What makes a city ‘good for mental health’ — and what the data confirms
Affordable cost of living, access to providers, and physical safety were the top three factors Americans cited when asked what makes a city good for mental health — a reflection of mental health trends that show growing demand alongside persistent access gaps. The cities that ranked highest overall balanced all three factors.
Provider access matters — but it’s not the whole story
One-third of Americans cited easy access to providers as a top factor for a mentally healthy city, making it the second-most prioritized factor in our survey.
New York leads the dataset in provider density, followed by Baltimore and San Francisco. But high provider density alone doesn’t guarantee a top overall ranking. New York finishes 12th overall because housing costs and income inequality partially offset that advantage.
Omaha (#6) tells a different story. It ranked 11th for providers per 100k residents, carries a low HPSA ranking, a below-average rent burden, and the fourth-lowest violent crime rate in the dataset. Its ranking reflects consistency across every pillar, outperforming every other Midwest city in the dataset.
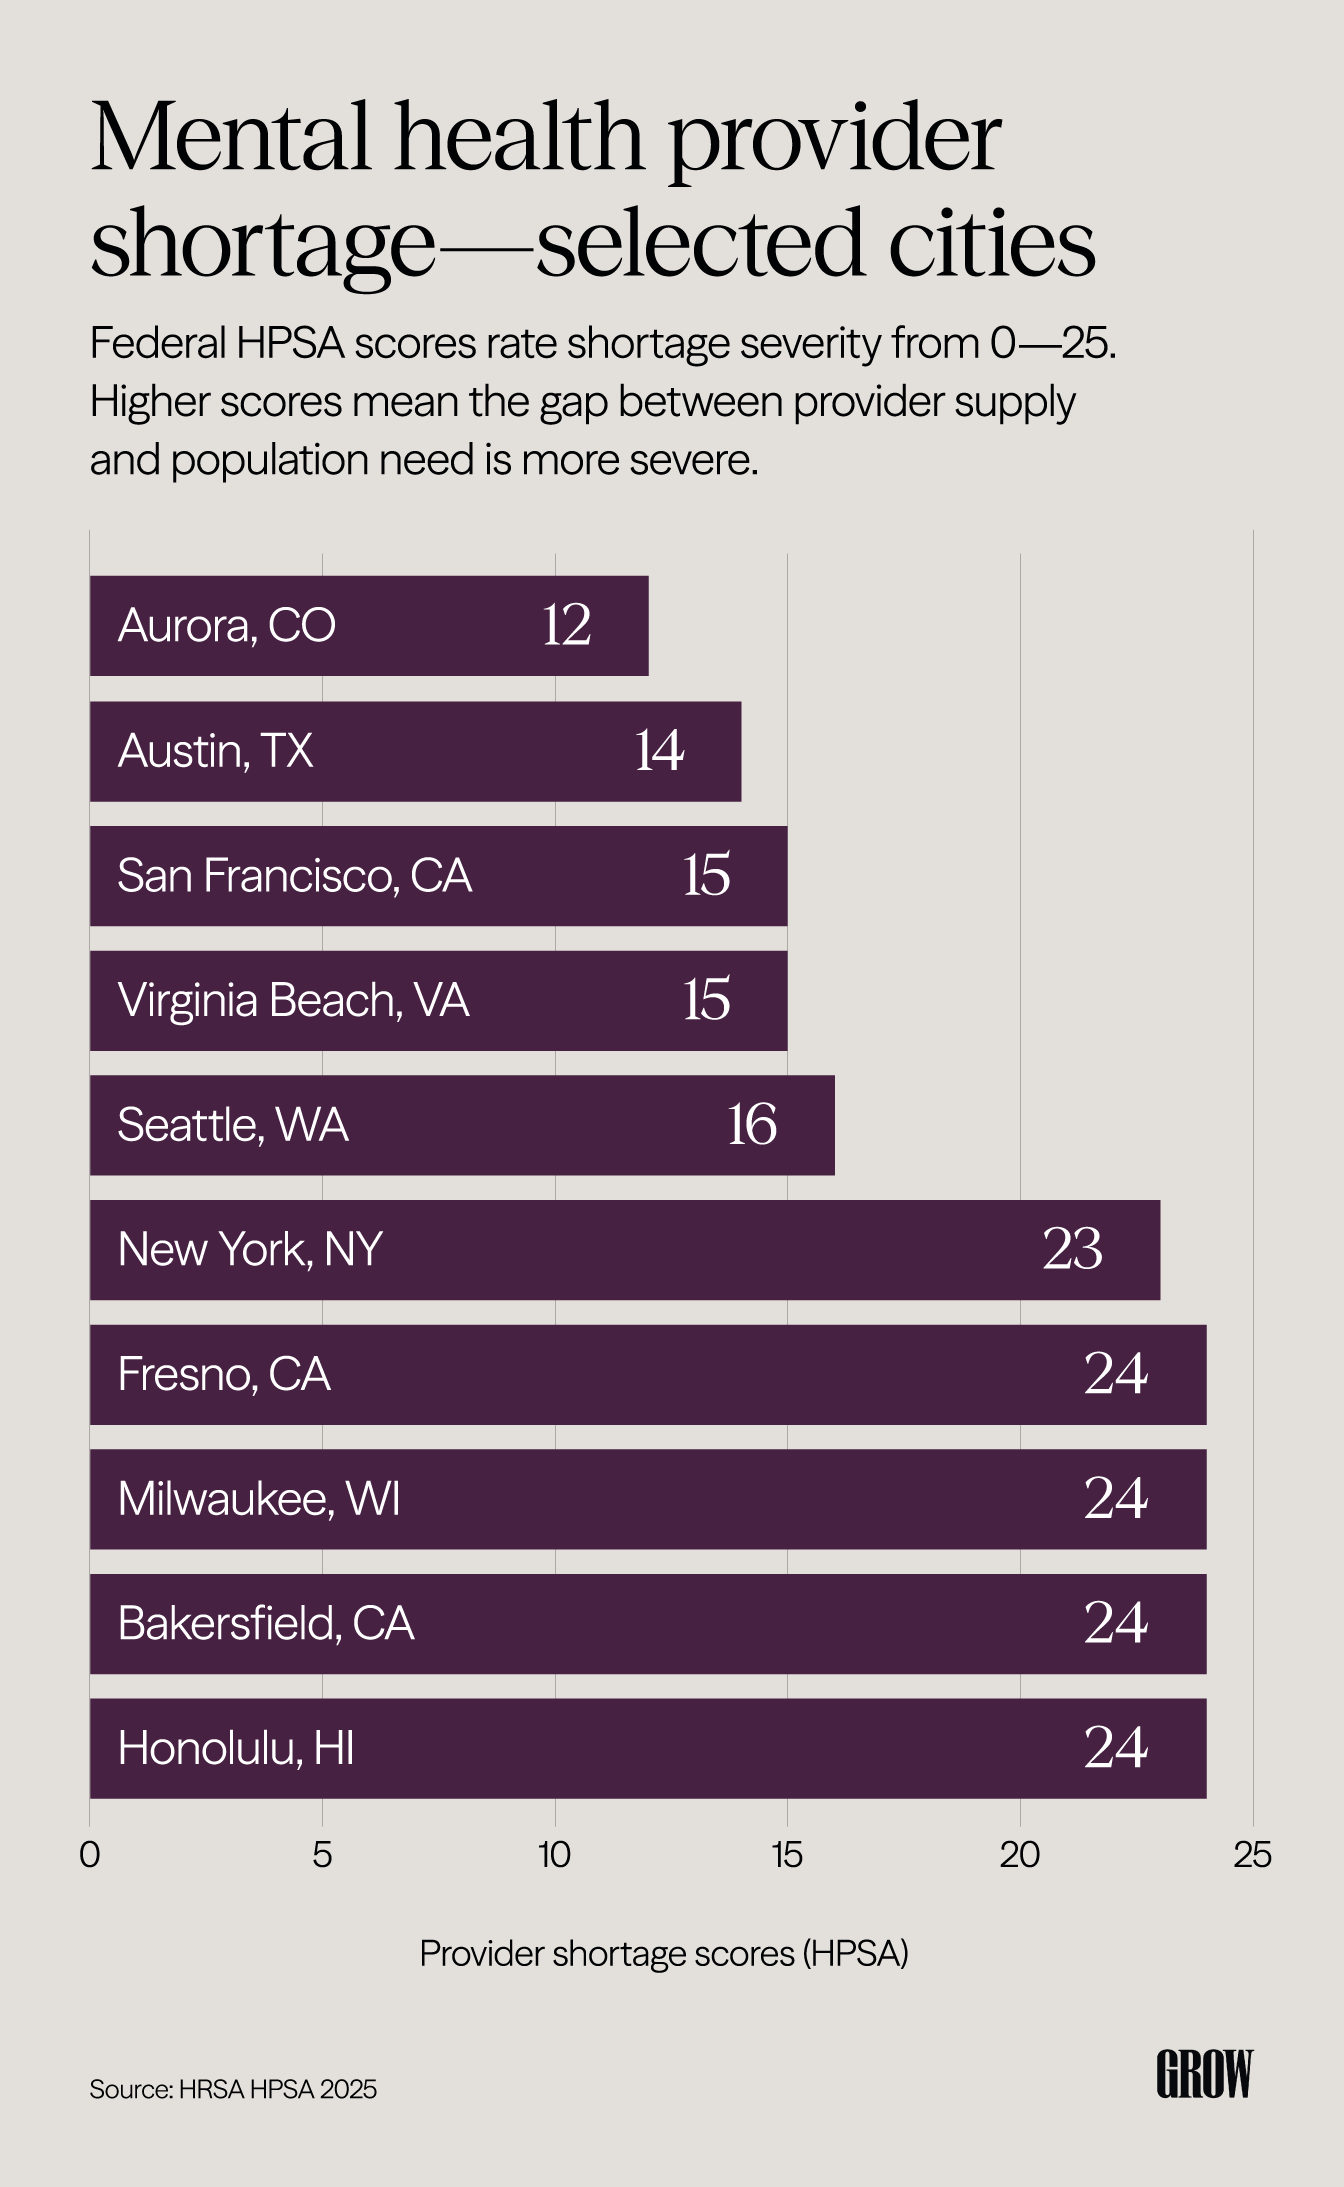
Beyond raw provider counts, the federal government measures where the need for mental health care outpaces available supply through Health Professional Shortage Area (HPSA) designations. That gap is rated on a scale of 0 to 25 — a higher number means more people in that area can’t get the care they need. Nearly every major city in this study carries a designation, meaning the shortage is widespread. The question is just how severe.
Aurora, CO has the lowest HPSA score in the dataset (least severe shortage), followed by Austin, which is part of why Austin earns #3 overall. At the other end, Milwaukee, Fresno, Bakersfield, and Honolulu all score near the maximum shortage severity. Residents there face a federally recognized gap between provider supply and population need.
A high HPSA score doesn’t automatically translate to a low overall ranking, though. Honolulu ranks 13th overall because its violent crime rate is the second-lowest in the dataset and its uninsured rate is very low. That shortage is partially offset by other structural supports. In cities with high HPSA scores, the gap between supply and need is backed by federal data, not just a perception.
Affordability runs through almost every top-ranked city
41% of Americans named an affordable cost of living as a top factor for a city that supports their mental health, and the data reflects that priority. Cities with the lowest rent burden (Austin, San Francisco, Seattle) all rank in the top 10. The cities with the highest housing costs relative to income — like Anaheim (#50) and Aurora, CO (#49) — rank lower overall as a result.
But how much of their income goes to housing costs is only part of the affordability picture. Whether someone has insurance and whether they feel confident using it shapes access just as much.
27% of Americans say it’s easy to use their insurance for mental health care. 16% have coverage but have never tried to use it for mental health. 9% say their insurance doesn’t cover mental health care at all. The difference between having insurance and knowing how to use it doesn’t show up in city data, but it’s real.
Cities that score well on both uninsured rate and provider density (like San Francisco and Washington, DC) are structurally better positioned to convert coverage into actual care.
On Grow’s platform in California markets, insured patients pay an average of $10.78 per session compared to $106.62 for cash pay. While that’s Grow Therapy platform data only (not the full market), it shows what the cost difference can look like when insurance is used for mental health care.
For a closer look at how coverage shapes what people actually pay, the Mental Health Benefits Confidence Report covers how Americans navigate their benefits and where the gaps tend to show up.
Safety shapes rankings more than it gets credit for
More than a quarter (26%) of Americans cited low crime and physical safety as a top factor for a city that supports their mental health, and the rankings reflect how much that variable moves the needle. Virginia Beach (#7) is the clearest example, with the lowest violent crime rate in the entire dataset. Provider density is modest, but safety and broadband access (ranked second) carry its overall ranking almost entirely.
Park access works similarly. Research consistently links green space to lower stress and better mental health outcomes over time, which is why it’s weighted alongside crime and safety rather than treated as a lifestyle variable. A neighborhood with walkable parks can be a meaningful part of how many people manage day-to-day stress.
The access gap — when cost, coverage, and provider supply all work against you
For most Americans, the harder question is what access looks like where they already are. When rent is high, providers are hard to find, or insurance is out of reach, those problems multiply.
The cost barrier shows up first
Affordability is where access breaks down first for most people. 21% of Americans have passed on mental health care because the out-of-pocket cost was too high — and for many others, the barrier is less visible. 11% weren’t sure what their insurance would even cover, and 9% discovered it didn’t cover mental health care at all.
National perception on affordability is nearly split three ways: 32% say mental health care in their area feels affordable, 34% say it feels unaffordable, and 34% aren’t sure. That near-even three-way split reflects a country where access is genuinely uneven. What drives that uncertainty isn’t clear. It could reflect limited experience with the system, anticipated cost, untested insurance coverage, or any number of other factors.
Where you live shapes what you expect
Regional perceptions of affordability aren’t evenly distributed. Northeast respondents are the most likely to say care feels unaffordable (39% net unaffordable), compared to 29% in the Midwest, the lowest of any region. The West (35%) and South (34%) track near the national average (34%).
The Midwest’s lower unaffordable rate isn’t necessarily a clean signal, though. 38% of Midwest respondents said they weren’t sure about the affordability of mental health care, the highest of any region. That uncertainty may mean many residents simply haven’t had enough contact with the mental health system to have a clear opinion. That’s its own kind of access barrier.
Structural barriers don’t always come from the same direction
Arlington, TX (#8) is worth looking at here. It holds the lowest rent burden in the entire dataset and the best income equality score, but a 47th-ranked uninsured rate is a real constraint. Having money helps. But without insurance, many people still can’t afford support.
Memphis shows what happens when multiple barriers hit at once. It ranks 50th overall, with the highest violent crime rate in the dataset, the lowest broadband access, a high rent burden, and some of the worst income inequality in the study (49th out of 50).
Getting an appointment is its own barrier
Just over half (51%) of Americans either expect difficulty getting an appointment or have no clear sense of what the process would look like, combining the 23% who think it would be difficult with the 28% who simply don’t know how challenging it may be.
The data backs that up. The national average wait time for behavioral health services is 48 days, according to the December 2025 HRSA Behavioral Health Workforce Report — nearly seven weeks before a first appointment. But on Grow Therapy’s platform, the typical wait is only two days.
For people in cities with high HPSA scores, that 48-day average may understate the actual wait. Telehealth has meaningfully changed the equation for many of them — though access still depends a number of factors, such as broadband availability, cost, and whether a provider is licensed in the patient’s state.
Ready to find a therapist who takes your insurance?
Finding support where you are
No city in this ranking is perfect or a lost cause. The cities at the top don’t share one standout advantage. What they share is the absence of stacked barriers. When cost, access, and safety align, the conditions for mental health support are meaningfully better.
For most Americans who don’t live in a top-ranked city, telehealth has changed the math. Distance is less of a barrier than it used to be, and finding a therapist who takes your insurance is more straightforward than most people expect. Although state licensing laws still require therapists to be licensed in the state where the client lives, telehealth has expanded the pool of available providers significantly.
For anyone who has held off looking into therapy because of cost concerns, the difference between what insurance actually covers and what people assume it covers is often significant. The complete guide to therapy is a good place to start understanding what’s actually available to you.
Wherever you live, Grow Therapy connects you with licensed providers who accept 125+ insurance plans — no matter your zip code.
Methodology
This analysis combines three data sources: a city scoring study, a national consumer survey, and proprietary platform data from Grow Therapy.
To identify the best cities for mental health in America, we reviewed and compared data across the 50 most populous U.S. cities as defined by the U.S. Census Bureau, ensuring the ranking reflects cities where a significant share of the American population lives and where data availability is most consistent. We ranked each city using a weighted scoring model across eight variables:
- Mental health providers per 100,000 residents (15 points)
- Mental Health Professional Shortage Area (HPSA) score (15 points)
- Uninsured rate (10 points)
- Rent burden (15 points)
- Income inequality, measured by Gini coefficient (10 points)
- Broadband access (10 points)
- Violent crime rate per 100,000 residents (13 points)
- Park access and walkability — measured as the share of residents within a 10-minute walk of a park (12 points)
For variables where lower values indicate worse outcomes — including violent crime rate and uninsured rate — cities were scored inversely, so better outcomes always produce higher point totals. Cities are presented by rank; raw scores are not included. All data reflects the most recently available year at the time of analysis, spanning 2022–2025 depending on the source. Three cities (Jacksonville, Atlanta, New Orleans) had unavailable violent crime data; one city (Charlotte) had unavailable park access data. In those cases, weights were prorated across remaining variables.
The survey was conducted by YouGov on behalf of Grow Therapy. Fieldwork was conducted February 13–16, 2026. Results are based on 1,203 completed surveys of U.S. adults 18 and older. Data is weighted to be representative of the U.S. adult population. The margin of error is approximately ±3% at the 95% confidence level.
This analysis also references data from Grow Therapy’s platform across 20 major U.S. metropolitan areas. Metrics include provider availability, therapist density per capita, appointment wait times, insurance utilization rates, average out-of-pocket treatment costs, telehealth utilization, and provider diversity indicators. Because most Grow providers are licensed state-wide and practice virtually, platform metrics reflect state-level patterns rather than city-specific data for most variables.